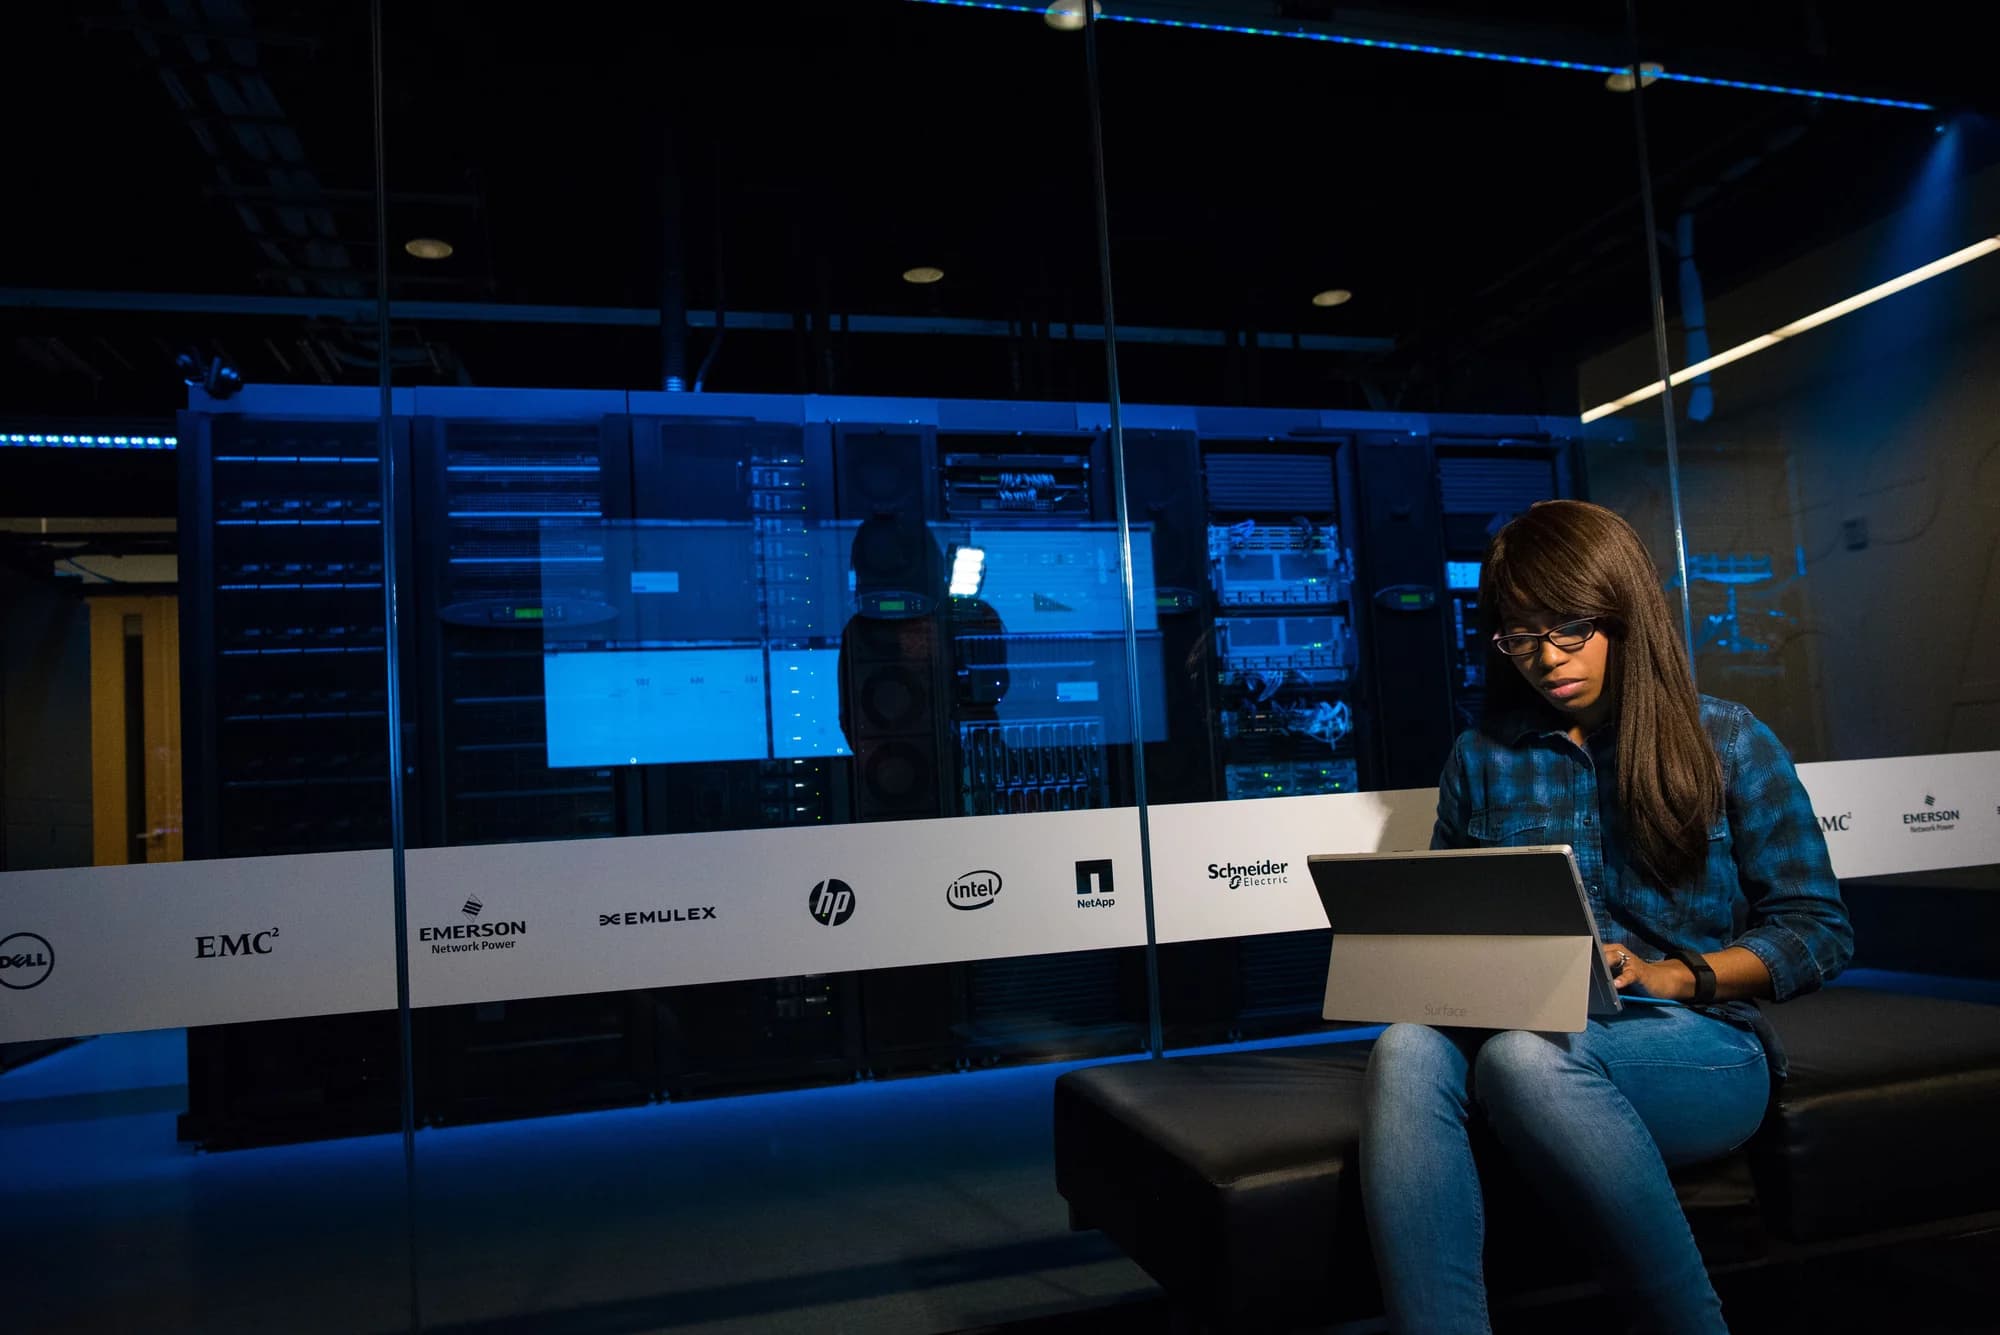
Ask a Kenyan data centre technician what they actually did last week and the honest answer is rarely "installed servers". It is closer to: closed forty tickets, checked a hundred dashboards, updated the rack map twice, chased one aircon fault through the building management system, and documented all of it. Data centre work looks physical from the outside, but inside it runs on software. Facilities are managed, monitored, documented and billed through tools, and the people who master those tools get promoted by them.
This article is the software stack, category by category: what each tool does, which products dominate, and, because we write for people trying to break in, which free versions you can install tonight. It pairs with our guides to certifications and getting hired.
DCIM: the living map of the facility
Data centre infrastructure management software, DCIM for short, is the category that defines modern operations. A DCIM platform holds a digital model of the facility: every rack position, every device, every power feed and network port, every cable run, together with the capacity each one has left. Raise a new cabinet request and the DCIM shows which rack has the power, the space and the cooling headroom to take it, before anyone walks the floor.
The big names Kenyan facilities deploy are Sunbird, Nlyte and Schneider Electric's EcoStruxure IT, often chosen because the facility's electrical and cooling vendor is Schneider already (Sunbird; Schneider Electric). What DCIM replaces is the honest enemy of every operations team: the spreadsheet. A rack inventory in a spreadsheet is out of date the first time someone moves a cable and forgets to write it down; a DCIM that is properly maintained becomes the source everyone trusts, and auditors love it because it proves discipline.
Practise it free: NetBox is the open source standard for exactly this kind of infrastructure documentation, racks, devices, cables, IP addresses, and it runs on a modest machine (NetBox Labs). It is not full DCIM, no live power telemetry, but the mental model it teaches, that a facility is a database first and a room second, is the one that transfers.
The building management system: where the facility talks
A data centre's electrical and mechanical plant, generators, UPS systems, chillers, air handlers, pumps, fire panels, reports through a building management system, the BMS. Technicians use it to watch temperatures and humidity per aisle, see power readings from the switchgear, receive alarms before humans feel them, and build the trends that justify maintenance. When a chiller starts cycling oddly, the BMS history is the evidence that says when it began.
In most facilities the BMS is a vendor platform such as Schneider or Siemens, sitting closer to the mechanical team than the IT team, and the boundary between the two is where good technicians add value. A network engineer who can read a BMS trend and say "your intake temperature rose two degrees after the cabling change" is worth more than either discipline alone.
Practise it free: You cannot run a real chiller at home, but the concepts, sensors, thresholds, alarms, trend logs, are the same ones Zabbix and Grafana teach, which is why the monitoring practice below doubles as BMS preparation.

Monitoring: the dashboards that never sleep
Monitoring software watches everything with an IP address and everything without one: is the switch reachable, is the UPS on bypass, is the humidity inside spec, is the website answering. Kenyan facilities typically run a stack rather than one product. A network monitoring platform such as Zabbix or Nagios polls devices and fires alarms; Grafana with Prometheus collects and graphs time-series data for humans to reason about; and log systems keep the receipts of what happened when.
The skill that employers actually test is not clicking around a dashboard, it is interpreting one. Why did this graph blip? What does a UPS transfer event look like, and how long is it acceptable? A candidate who can read a latency spike and reason aloud about upstream versus internal causes sounds like a hire, whatever tools they learned on.
Practise it free: Zabbix is open source and runs on a single Linux virtual machine (Zabbix); point it at a router, a Raspberry Pi, anything with SNMP, and you have real alerts and real graphs. Add Grafana in front of it and your home lab starts looking professionally boring, which is the goal.
Ticketing and asset management: the paperwork that is the job
Every task in a disciplined facility, every rack move, every filter change, every customer request, exists as a ticket. Ticketing platforms, ServiceNow, Jira Service Management, Freshservice, or a homegrown CMMS for the maintenance side, carry the request, the approval, the change window, the execution record and the closure note. Asset management systems track every physical thing: which serial numbers the facility owns, where they are, their warranty and their lifecycle.
Young technicians often experience ticketing as bureaucracy. Senior people know it is the memory of the organisation: the ticket history is how a facility proves what changed when, spots repeat offenders among its equipment, and answers the auditor's question with evidence instead of memory. A well-written ticket, problem, action, result, is a professional document, and hiring managers read them that way.
Practise it free: Snipe-IT is a solid open source asset tracker you can run for a home lab's inventory, and your own change log in a wiki or Git repository teaches the same discipline ticketing enforces.
The engineer's own bench: operating systems and networks
Underneath everything sits the stack the tenants actually run, and facility engineers touch it constantly: Linux on most servers and appliances, Windows in enterprise corners, virtualisation platforms that turn one server into many, VMware ESXi commercially and Proxmox VE in the open source world, and the network tooling of the trade. Wireshark for packet-level answers, iperf for throughput tests, SSH for everything, and increasingly Ansible-style automation so a change applied to forty switches is a template, not forty mistakes.
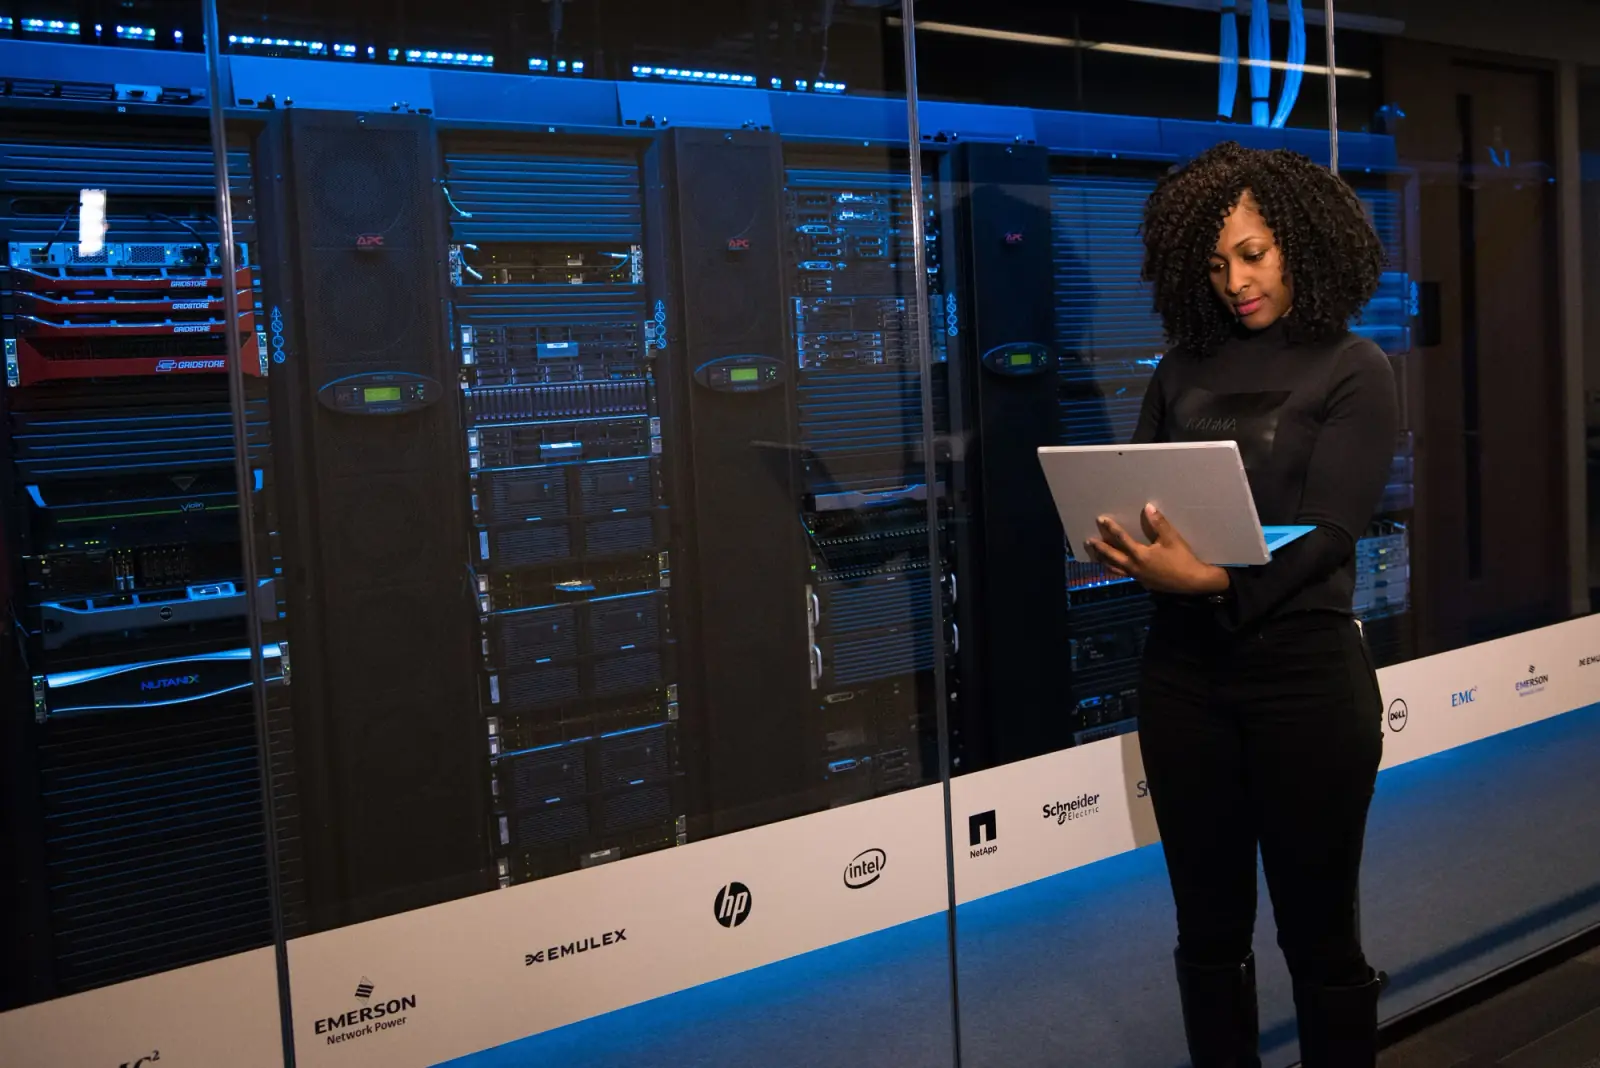
Practise it free: Proxmox VE is free and turns any half-decent computer into a virtualisation host; install it, break it, fix it. Wireshark and Ansible are free outright. Linux fundamentals cost nothing but evenings and are the single highest-return investment a Kenyan candidate can make, because every monitoring tool, DCIM appliance and BMS server in a real facility is a Linux box wearing a costume.
How the stack fits a Kenyan career
Map the categories to the roles and the strategy becomes obvious. Facility technicians live in the BMS, ticketing and DCIM; NOC engineers live in monitoring and the network bench; systems and cloud engineers live in the virtualisation and automation layers; and the managers who advance furthest are fluent in all of it, because capacity planning is just the DCIM database with a spreadsheet's intention.
The Kenyan route in is the same as the global one, with a local twist: the free tools above give you genuine practice without a job or a lab budget, the certifications from our Kenya guide get you past the HR filter, and the interview differentiator is the thing this article is really about, being able to say, specifically, which software you have run, what broke, and how the tools helped you fix it. Start with Linux and Zabbix this week. Add NetBox the next. By the time a facility calls you in, you will be explaining dashboards from experience, not from YouTube.