
Railways. Electrification. The internet. Each required enormous capital and defined an era, and, according to PwC's data centre outlook published with modelling by Oxford Economics, the AI infrastructure cycle now underway dwarfs all three. In the central scenario, data centres attract US$31.6 trillion of capital expenditure globally through 2050, within a range of about $22 trillion to nearly $50 trillion depending on how fast AI adoption runs. Annual spending accelerates as it goes: roughly $800 billion in 2026, $1.1 trillion by 2030, $1.8 trillion by 2050. Unlike every previous infrastructure wave, this one does not tail off when the network matures, it resets every four to six years, because the capital goes into what fills the buildings.
For an African readership, the forecast's most important page is not the topline. It is the region table, where Africa's $255 billion cumulative capex sits slightly below its share of global GDP but carries a growth profile PwC describes, paradoxically, as one of the lowest-risk capex stories on the map, and where Kenya's power grid, at approximately 95 percent renewable, gets named one of the most sustainably powered data centre markets in the world. This article unpacks the numbers, the five forces PwC says decide where capital lands, and what the two geopolitical scenarios PwC stress-tested would mean for East Africa's place in the flow.
Why This Capex Cycle Never Ends
The structural insight underneath the $31.6 trillion is a ratio most markets still underprice: every $1 of construction capex effectively commits the industry to roughly $12 of future ICT equipment spend. Buildings and utility connections have long useful lives; the servers, storage, networking, CPUs, and crucially GPUs inside them age out in four to six years, meaning a single data centre may need three to five rounds of equipment investment over a 20-year asset life. PwC's memorable formulation (the data centre as essentially a chip-replacement subscription with a building wrapped around it) inverts the pattern of every prior infrastructure wave, which front-loaded construction and let spending decay as networks matured.
The composition shifts over time in a way that matters for equipment-heavy markets. ICT equipment rises from 70 percent of total capex in 2026 to 93 percent by 2050, driven by AI workloads that rely on expensive, energy-intensive accelerators following a fast innovation curve. Higher rack densities force power and cooling upgrades alongside, but the largest recurring share is the compute itself. For African markets, this is a quiet warning about import dependence: a region with limited semiconductor depth and weaker access to advanced ICT equipment captures the construction share of the cycle but leases the technology share, a distinction the downside scenario below makes painfully concrete.

The demand base widens too. The cloud era had essentially one customer profile, hyperscalers. The AI era adds at least five more: neoclouds, model developers, inference platforms, enterprises, and governments, each with different demand and risk profiles. About 30 percent of workloads today carry localised requirements (latency, data access, privacy, and sovereignty constraints that pull capacity toward the users) and PwC expects that share to grow, which is precisely the slice of demand African markets can realistically compete for.
The Five Forces Deciding Where Capital Lands
PwC's framework for who captures the spending comes down to five forces, and reading them through a Kenyan lens is instructive. Power sits at the top: affordable, reliable, increasingly low-carbon electricity at scale is the hardest requirement for most markets, and transmission capacity, substation availability, and multiyear transformer lead times have become the bottlenecks that determine which projects break ground and when. In Kenya, that is not an abstraction, grid interconnection timing already shapes facility timelines, and the operators who secure megawatts fastest will capture a disproportionate share of regional demand.
The next three forces sort markets by workload type. Latency and connectivity determine which regions can credibly serve consumer and enterprise inference, a contest Nairobi's submarine cable gateway position and internet exchange depth actually play into. Security and trusted-region hosting decide where regulated and sovereign data goes, which rewards markets with credible data protection regimes. GPU access and ecosystem depth govern the frontier: which markets can host training clusters at all, given chip availability and technical talent. Policy certainty and community consent aggregate the rest, converting underlying advantages into capacity that actually gets built.
PwC is explicit that sustainability is not modelled as a separate variable but runs through all five forces as either advantage or constraint. Markets with renewable-heavy grids and credible decarbonisation pathways carry a structural comparative advantage the model picks up through their power positions. That single sentence is the most under-appreciated paragraph in the entire outlook for anyone sitting on the East African rift.
Africa's $255 Billion: The Only Non-AI Bet on the Map
The regional numbers deserve close reading. The Americas account for $16.5 trillion in cumulative capex through 2050, with the US alone at $15.1 trillion, around 48 percent of the global total. Asia-Pacific takes $8.2 trillion, Europe $5.6 trillion, the Middle East $1.1 trillion on the fastest CAGR in the forecast, and Africa $255 billion, the smallest number, but attached to the lowest-variance story.
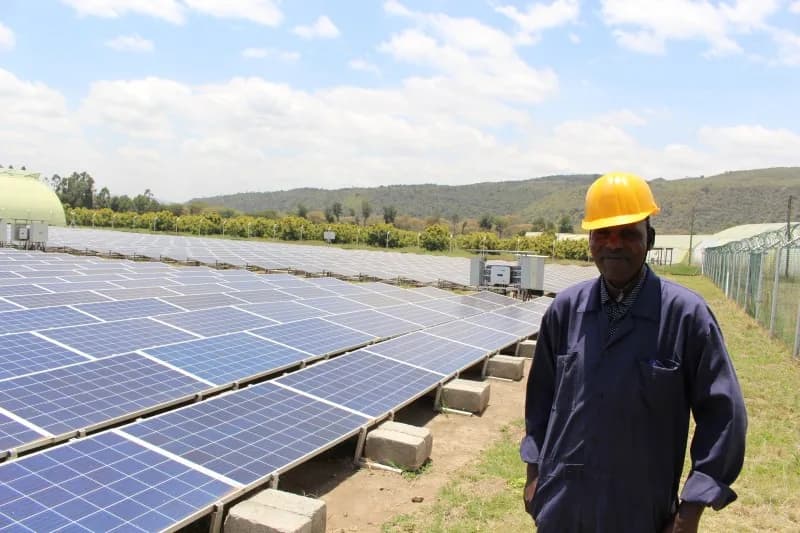
PwC's reasoning is worth quoting in spirit: Africa is the only region whose central scenario is not a bet on AI. The continent is largely buying foundational digital infrastructure (cloud storage, enterprise compute, connectivity) that pays off regardless of which AI scenario plays out. Slower AI adoption removes roughly $10 trillion from the global cycle and leaves stadium-sized facilities half empty in other regions; in Africa it simply means the foundational build continues on its own logic. South Africa anchors the region with the most established data centre base, while Kenya, Nigeria, and Ghana are named among the most promising emerging markets. And Kenya's distinctive position is its grid: approximately 95 percent renewable, a mix our renewables analysis and geothermal deep-dive examine from the engineering and economics sides, the kind of low-carbon baseload that PwC's framework treats as a structural power advantage rather than a press release.
Two Scenarios That Redraw the Map
The forecast's stress tests matter as much as the base case, and they pull in opposite directions for Africa.
The first scenario escalates today's export controls to peak trade-war intensity: advanced GPUs become harder to procure across a wide set of markets, and retaliatory raw-material restrictions propagate along the semiconductor supply chain. Global cumulative capex falls from $31.6 trillion to $25.5 trillion by 2050 (a roughly $6 trillion shortfall) with the Middle East the most proportionally exposed region and AI-heavy pipelines hit first. Africa is not a direct target of export controls but absorbs meaningful second-order disruption through limited semiconductor depth and weaker access to advanced ICT equipment, with cumulative capex falling from $255 billion to $193 billion. The lesson for African operators is about equipment strategy: hardware-flexible designs, phased procurement, and vendor diversification are hedges, not luxuries.
The second scenario tests sovereignty as an organising principle: governments and regulated industries stop relying on foreign infrastructure for critical workloads while non-critical demand keeps moving. Total capex barely moves (down 6.7 percent to $29.5 trillion) but the redistribution is dramatic. Africa records the largest proportional uplift of any region, with cumulative capex rising roughly 12 percent from about $255 billion to $284 billion, supported by near-term onshoring of cloud storage and longer-term AI market development. It is one of the few scenarios in which Africa is a net winner, and it runs directly through the localisation frameworks already being legislated across the continent, including Kenya's data sovereignty rules.
What It Means for Kenya
Translated into Kenyan strategy, PwC's recommendations compress into four moves. Compete on speed to power: pre-procure long-lead grid components and press for predictable interconnection queues, because transmission timing now decides which projects break ground. Design for optionality: phased grid connections, modular capacity, and hardware-flexible cooling preserve value if AI accelerates and limit stranded-asset exposure if it does not. Sign long-dated leases with resilient counterparties (hyperscalers, sovereign vehicles, regulated industries) whose demand survives the slow scenarios; the off-take, not the building, is the hedge. And plan the low-carbon build from the start, because markets where renewable capacity scales alongside data centre siting convert a compliance story into a siting advantage, the position Kenya already occupies, as our AI infrastructure in East Africa analysis argues from the demand side.
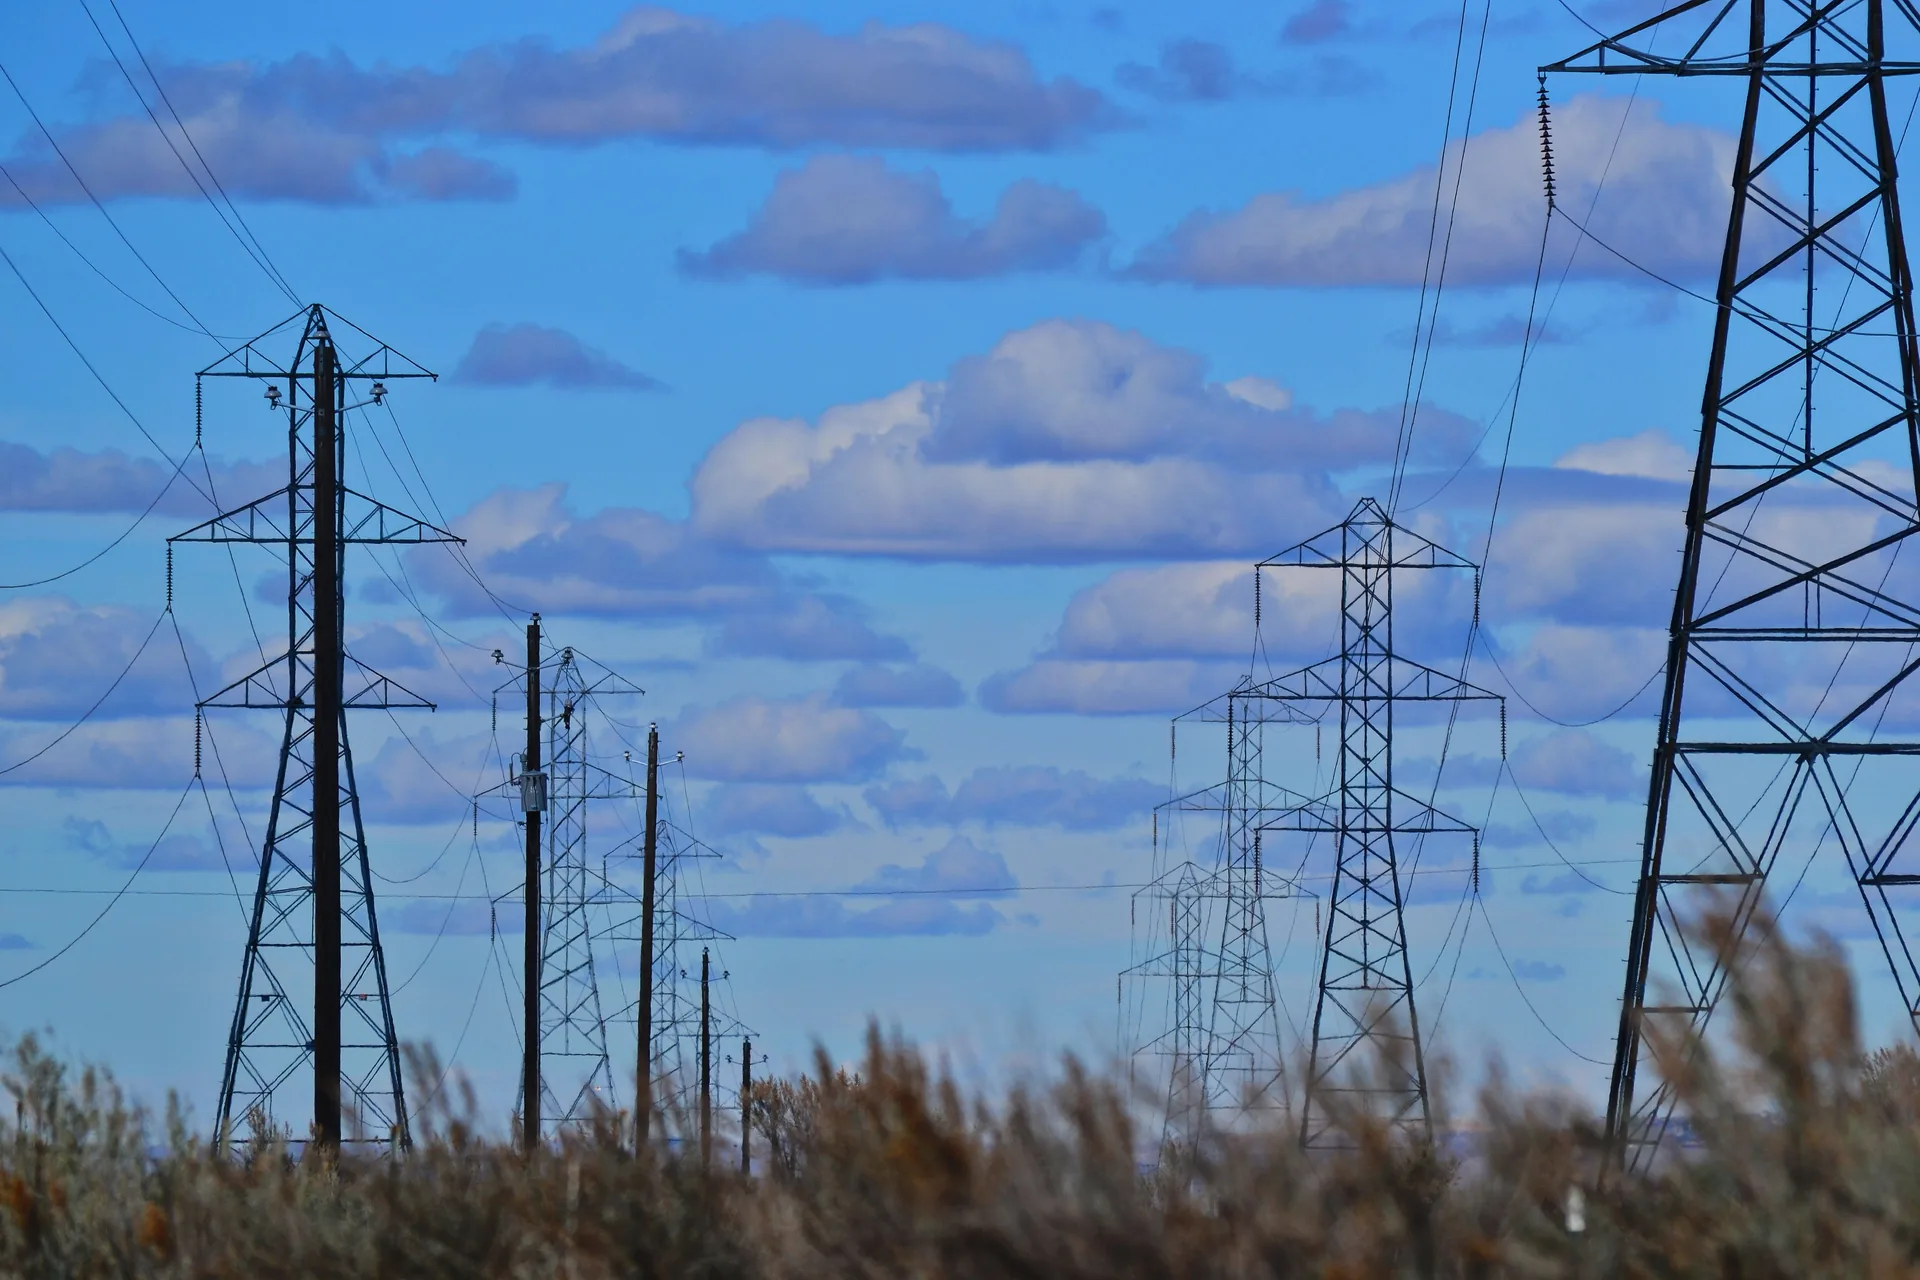
The $31.6 trillion question, PwC concludes, is not whether the capital exists or whether the demand is real, it is which regions, operators, and institutions are positioned to capture it. Africa's answer is unlikely to be gigawatt training campuses. It is far more likely to be the sovereign, carbon-conscious, latency-bound workloads that the sovereignty scenario rewards and that Kenya's renewable grid is uniquely configured to host. The forecast's map of 2050 will look little like 2026's. Kenya's job, between now and then, is to make sure the redrawn lines run through Nairobi.