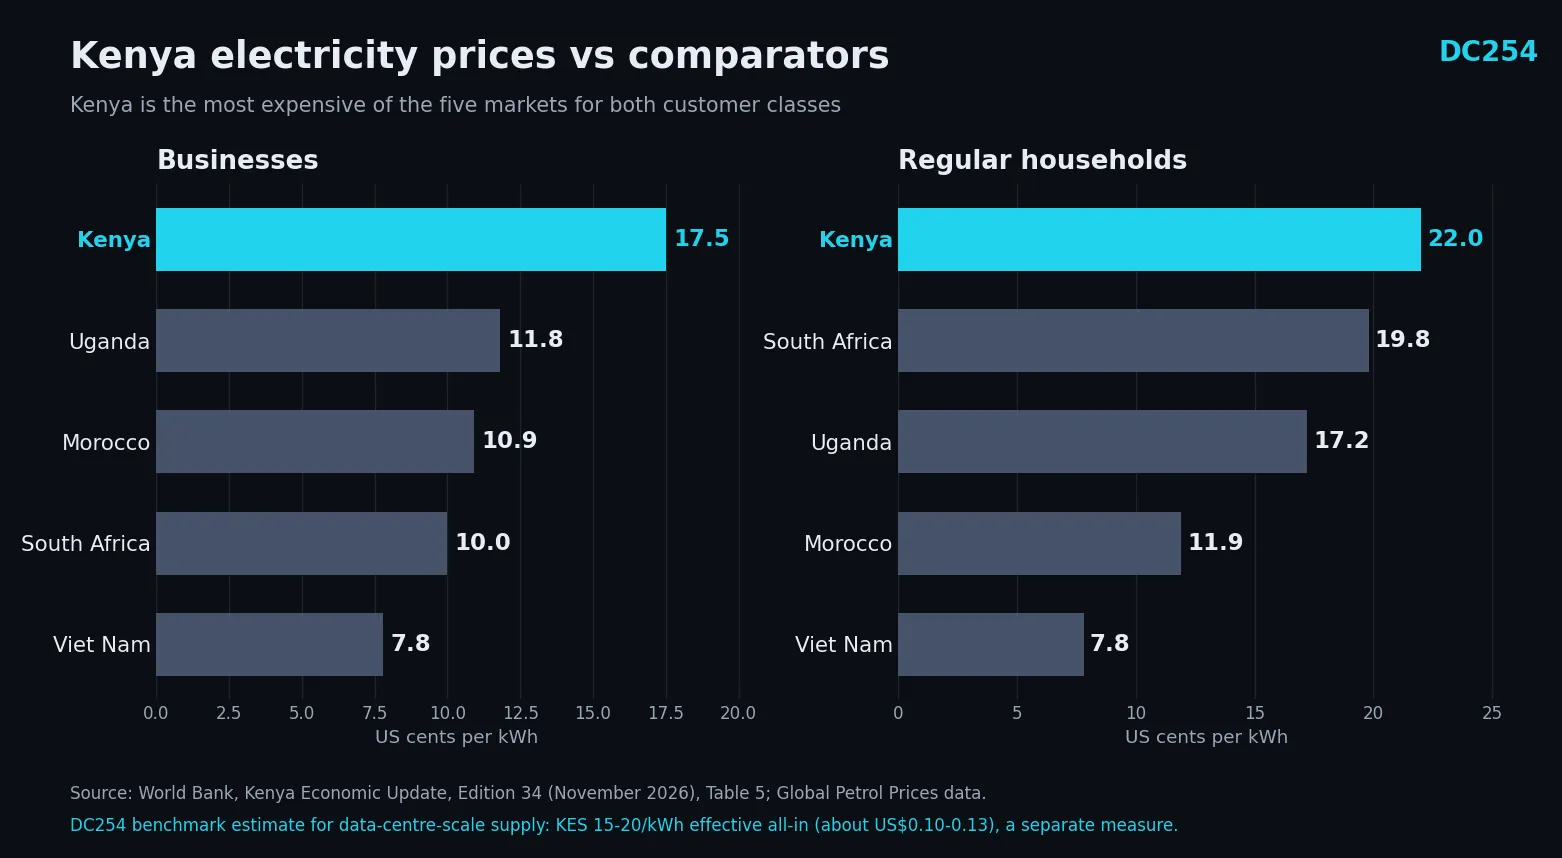
Kenya has built one of the cleaner electricity grids on the continent: roughly 90 percent renewable generation, anchored by firm geothermal capacity at Olkaria. The World Bank's Kenya Economic Update, published on 3 November 2026, puts a number on what businesses actually pay for that power: about 17.5 US cents per kilowatt-hour, more than double Viet Nam and described by the report as close to 50 percent higher than in Uganda. One clarification before anything else: that figure is a business electricity-price benchmark, not a tariff paid by data centres. But for an industry where electricity is the largest recurring operating cost, the report's explanation of the gap matters as much as the number itself. Its special focus this year is governance, and its diagnosis is that Kenya's power premium is made in contracting and system management, not in the steam field.
What Kenyan Businesses Actually Pay
The comparison comes from Table 5 of the report, using Global Petrol Prices data:
| Customer class | Kenya | Viet Nam | Morocco | South Africa | Uganda |
|---|---|---|---|---|---|
| Regular households | 22.0 | 7.8 | 11.9 | 19.8 | 17.2 |
| Businesses | 17.5 | 7.8 | 10.9 | 10.0 | 11.8 |
Kenya is the most expensive of the five for both customer classes. Businesses in Morocco and South Africa, two of the countries Kenya competes with for digital infrastructure investment, pay roughly 38 to 43 percent less per unit.
It is worth being precise about what the 17.5 cents measures. It is an economy-wide business electricity-price benchmark: an average across business customer sizes, not a published tariff and not a verified average bill for data centres. DC254's own power tariff tracker estimates the effective all-in cost of data-centre-scale supply at KES 15-20 per kWh, about 10 to 13 US cents, blending the industrial energy charge with demand charges, fuel levy and other pass-through costs. The two figures are different measures with different methodologies and different customer categories, and they are not contradictory: a hyperscale load contracted at industrial class lands in our range, while the World Bank benchmark describes the average price facing Kenyan businesses of every size. Both point the same direction. Power is a material cost line in Kenya, and the governance findings explain the pressure inside the tariff base. How Kenya Power's tariffs are structured for data centres explains where the metered number comes from.
The Gap Is Not the Resource
Kenya's generation story is genuinely strong. The grid runs on roughly 90 percent renewables, the Olkaria complex alone accounts for around 800 megawatts of geothermal capacity, and geothermal supplies roughly 45 percent of the country's electricity generation. The World Bank does not dispute the engineering. Its argument is about what happens between the power plant and the customer.
The cost of electricity to a business reflects the generation source and everything layered on top of it: power purchase agreements, transmission and distribution, system losses, regulatory arrangements and financing charges. The report is direct about the governance layer: the absence of a comprehensive and competitive framework for granting PPAs, conflicts of interest, and a lack of transparency in contract management "create an environment conducive to higher-cost PPAs". Generating electricity at a competitive cost does not automatically produce competitive electricity prices. The system in between matters.
Power Purchase Agreements: Where Cost Gets Locked In
A power purchase agreement is a long-term contract through which Kenya Power buys electricity from a generator, public or private. The World Bank notes that Kenyan PPAs generally include take-or-pay clauses, which give developers revenue certainty but commit the purchaser to guaranteed charges whose terms differ significantly across contracts.
The origins explain part of the problem. Early PPAs were issued in response to declining hydropower generation during droughts in the late 1990s and again in the late 2000s. The report accepts that some of those cost increases were unavoidable. It also observes that emergencies are often misused by rent-seeking interests, and that Kenya's competitive procurement procedures, despite the country's substantial experience with them, have not been consistently followed across successive rounds.
How inconsistent? A 2021 assessment by EED Advisory and the Energy for Growth Hub, cited in the report, found that out of 42 PPAs signed by Kenya Power, only 24 percent were known to have gone through a competitive process. The report adds that international evidence shows competitively procured solar projects come in about 47 percent cheaper than directly negotiated deals, and that a Renewable Energy Auction Policy drafted in 2021 to provide a more competitive framework has never been put into practice.
The report's Box 6, titled "High-cost IPPs and conflicts of interest", goes further. It records that the integrity of power purchase agreements has been investigated by both the Presidency and the National Assembly, that some public officials involved in approving IPP projects were later employed by or owned the relevant generation companies, and that beneficial ownership of IPP contractors remains largely opaque: when the Business Registration Service gave a parliamentary committee a list of IPP owners and shareholders, the majority were foreign corporations whose ultimate beneficial owners were unknown. The report also cites the Lake Turkana Wind Power case, where delays in constructing the transmission line left the government paying the equivalent of US$150 million under take-or-pay deemed-energy clauses for power that was never used.
These are institutional findings about procurement and contract governance, not proof of criminal wrongdoing by particular individuals or companies. But their cost lands on every meter, because the contracts feed Kenya Power's tariff base and pass through to business and industrial customers.
Losses: Paying for Power That Never Reaches a Meter
The second cost layer is the network itself. The World Bank finds that Kenya's transmission and distribution losses have remained stubbornly high at over 23 percent, against a target of 16.5 percent set by the Energy and Petroleum Regulatory Authority and 15 percent by 2029/30. It attributes the gap to underinvestment in the grid, rapid access expansion in rural areas, and theft and billing anomalies enabled by collusion, with integrity investigations at Kenya Power ongoing since 2023.
Losses matter because the cost of generating and purchasing power must be recovered whether or not the electricity reaches a paying customer. Every percentage point above target is spread across the tariffs of customers who do pay. For a large electricity user, the efficiency of the wider network affects the bill as much as the capacity of any individual power plant.
What This Means for Data Centre Competitiveness
Data centres run continuously, and their electricity draw extends well beyond servers: cooling, electrical infrastructure, lighting and security all ride on the same meter. Power is typically the largest recurring operating cost, and the meter runs harder than the IT load suggests. A 1 megawatt IT load at a power usage effectiveness of 1.6 consumes about 14.0 gigawatt-hours a year. Measured on the benchmark rates, the spread against South Africa's 10.0 cents works out to roughly 1.05 million dollars a year for every megawatt of IT load, before a single rack is sold. That is the arithmetic that either compresses operator margins or surfaces in Nairobi rack prices, and against the effective all-in rates in our power tariff tracker it is the spread investors will model first.
Capital is pricing the same constraint from the industry side. Forbes Africa's November 2026 market review, drawing on Africa Data Centres Association figures, puts the continent's live capacity at roughly 360 megawatts, with 238 megawatts under construction and 656 megawatts planned, about 0.6 percent of global capacity for a continent holding a fifth of the world's population. Its central observation matches this article's diagnosis: power availability, not connectivity, has become the principal constraint on African data centre expansion, and the capital that is moving, from OADC's 240 million dollar Lagos expansion toward 24 megawatts by 2027 to MTN's 240 million dollar Dabengwa facility and Kasi Cloud's 250 million dollar campus, is moving toward markets that can secure firm, affordable power. That is exactly the axis the World Bank's governance findings sit on. Kenya competes with Nigeria, Morocco and South Africa for the same digital infrastructure investment, and Table 5 shows businesses in Morocco and South Africa paying roughly 38 to 43 percent less per unit than Kenyan businesses do. Delivered power cost is now a siting decision, not a footnote.
The demand side is growing. The report expects investment growth to stay above 5 percent a year, supported partly by digital infrastructure and technology-related projects, and DC254's data centre tracker separates live facilities from projects under construction, committed developments and early-stage proposals that would add meaningful load if they proceed. Pipeline is potential demand, not current consumption, and the World Bank's own account of the power sector shows why that distinction matters: excessive demand projections were part of how the sector accumulated expensive capacity in the first place. Developers planning a 20, 50 or 100 megawatt facility need answers on the cost of grid connection, the capacity available at the site, supply reliability, applicable energy and demand charges, backup generation and the contract terms for long-term supply. So do the planners on the other side of the table. Kenya's pipeline beyond Nairobi shows where that load is expected to land.
Olkaria: Where the Advantage Meets the Test
The clearest illustration of the gap between renewable advantage and delivered power is at Olkaria itself. In May 2024, during President William Ruto's state visit to Washington, Microsoft and G42 committed around 1 billion dollars to a geothermal-powered data centre campus in the region of 100 megawatts of IT load, planned for the area of Kenya's largest steam fields. The project never broke ground. By May 2026, Semafor reported President Ruto saying the facility would have required about a third of Kenya's roughly 3,000 megawatts of installed capacity, and that the National Treasury never approved the technology ministry's funding concept note. Our directory records the project as early stage, with no confirmed site.
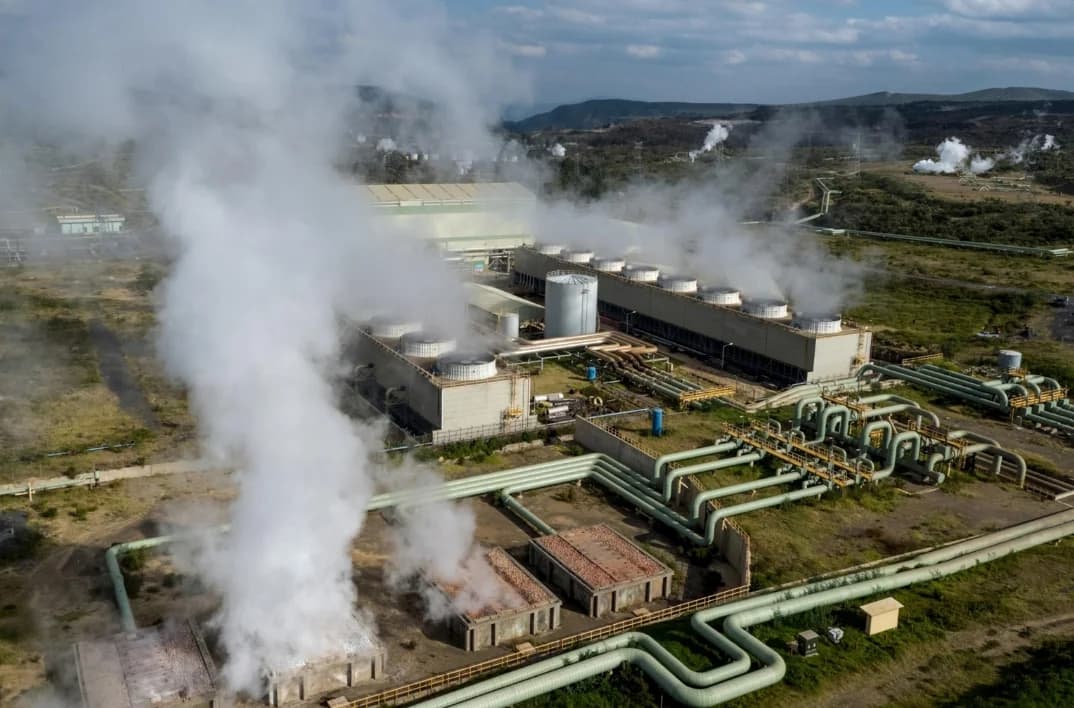
The lesson is not that Olkaria is the wrong location. It is that a renewable proposition and a bankable power arrangement are different things. A developer needs confidence in scale, price and reliability; the power provider needs confidence that the demand and revenue used to justify investment will actually materialise. What stalled the Microsoft and G42 project at Olkaria follows the corridor idea, putting compute near the wells, as the response to exactly the transmission and contracting costs the World Bank describes. The same governance questions the report raises are the ones that decide whether such projects get financed.
What Would Narrow the Gap
The report's findings point to a reform agenda with five parts that matter for anyone building digital infrastructure in Kenya:
- Competitive procurement. Operationalise competitive rounds for new generation contracts; the evidence cited in the report puts competitively procured solar at about 47 percent cheaper than directly negotiated deals.
- Transparency. Publish procurement processes, contractual obligations and beneficial ownership for new PPAs; the report counts the 2025 Conflict of Interest Act as progress on regulating vested interests.
- Stronger oversight. Regulatory review should ensure that contracts and tariffs protect consumers while sustaining investment.
- Loss reduction. Moving from over 23 percent toward the 16.5 percent target removes a real cost from every tariff in the system.
- Credible demand planning. Large loads should be assessed against realistic forecasts, with developers bearing an appropriate share of the infrastructure their projects require.
The report's reform modeling is economy-wide, not a tariff forecast: moderate anti-corruption reforms could lift GDP by 8.7 percent by 2035 relative to a non-reform scenario, rising to 22.3 percent with stronger measures, while reducing the debt-to-GDP ratio by up to 18 percent relative to the status quo and creating more and better jobs for up to 7.7 million people. Those are demand-side numbers. For power specifically, the fixes operate on contract timelines measured in years. The race to power Kenya's AI data centres will price in whatever progress arrives.
What DC254 Will Watch
- New PPA disclosures. Whether future power purchase agreements publish counterparty beneficial ownership at signing rather than after parliamentary inquiry.
- Procurement format. The share of new capacity contracted through competitive rounds versus direct negotiation.
- The auction policy. Whether the Renewable Energy Auction Policy drafted in 2021 is ever operationalised.
- EPRA tariff reviews. Whether the next cycles pass generation-cost relief through to business and industrial classes.
- Operator hedging. How much new data centre capacity is paired with dedicated renewable PPAs or on-site generation, and whether the 17.5 versus 10.0 cents spread against South Africa narrows.
Kenya's renewable energy advantage is real. The World Bank's November 2026 diagnosis explains why the bill does not yet show it, and what turning that advantage into competitive delivered power would actually take: better contracts, a tighter grid and demand planning that both sides of the table can believe.
Editorial note: the 17.5 US cents per kWh figure is the World Bank's business electricity-price benchmark for Kenya, drawn from Table 5 of the November 2026 Kenya Economic Update. It is not a published tariff or a verified average electricity bill for Kenyan data centres. DC254's data-centre tariff figures, including the power tracker's KES 15-20/kWh effective all-in range, are separately identified estimates and benchmarks.